Reading Time: 5 minutes
Now that the new website is rolled out, I wanted to take some time to explain the tools that exist here for searching through the robust amount of data that I’ve collected over the past decade. You’ll notice that the menu at the top of the website has four drop-down sections. “Articles” is pretty self-explanatory, but I’ll do a post each day for three days to explain the tools under “Database,” “Chart, Graphs, & Maps,” and “Politicians & Offices.”
Election results
I’ve always said that the election results are the heart and soul of this website. To date, I have entered 1,300 separate elections across more than 80 individual years. Anything from around the 1850’s to today comes directly from Secretary of State certified numbers, making this the only website where you can find official numbers prior to the 2000’s online. You can find a list of the elections currently in the database under the “Database” menu, or by clicking here.
Having all that data is one thing, but being able to sort through it in an easy way is another. On the Election Results page, you can easily do this by filtering them across six different categories by clicking on the appropriate filter button:
- Election type: You can select only general elections, only primary elections, only special elections, or any combination of the three.
- Year: I have results for gubernatorial races back to 1816, so you can search in any year that a state or federal election was held in Indiana. You can do this by picking a single year, a range of years, anything prior to or after a given year, or by manually selecting random years.
- Office: For the offices in the election results database (which is U.S. Senate, U.S. House, and all statewide state-level offices that were still on the ballot as of 2018), you can choose one or multiple. I’ve included buttons within that filter (under “Multiple Offices”) that allow you to select all U.S. Senate, all U.S. House, or all Statewide (state level) offices with one click.
- Incumbent: This allows you to specify if you want to find races that are open seats (no incumbent) or when an incumbent is running for re-election (with further ability to look only for races where the incumbent won or lost).
- Votes: Specify certain scenarios based on the winning or losing candidate’s vote total or vote percentage, or the total votes cast or margin of victory. For instance want to find the last time a candidate won with less than 45%, or find all the races that had a margin of victory of less than 20 votes? Then use this filter.
- Party: This allows you to find races where a specific party won, or a specific party was just on the ballot. More often than not, this will be useful in conjunction with other filters, as I’ll demonstrate with an example momentarily.

So let’s say that you’re interested in finding out how often Democrats have won open statewide races since the Constitutional reforms of 1970 changed the when we elect those officials and for how long they serve. As in the image above, set Election Type to “General elections only”; Year to “After 1970”; Offices to “All Statewide”; Incumbent to “Open races (no incumbent)”; Votes to “All scenarios” (the default); and Party to “Democratic candidate wins.” Press the filter button, and you you’ll get a list of election results for the six open races they’ve won.
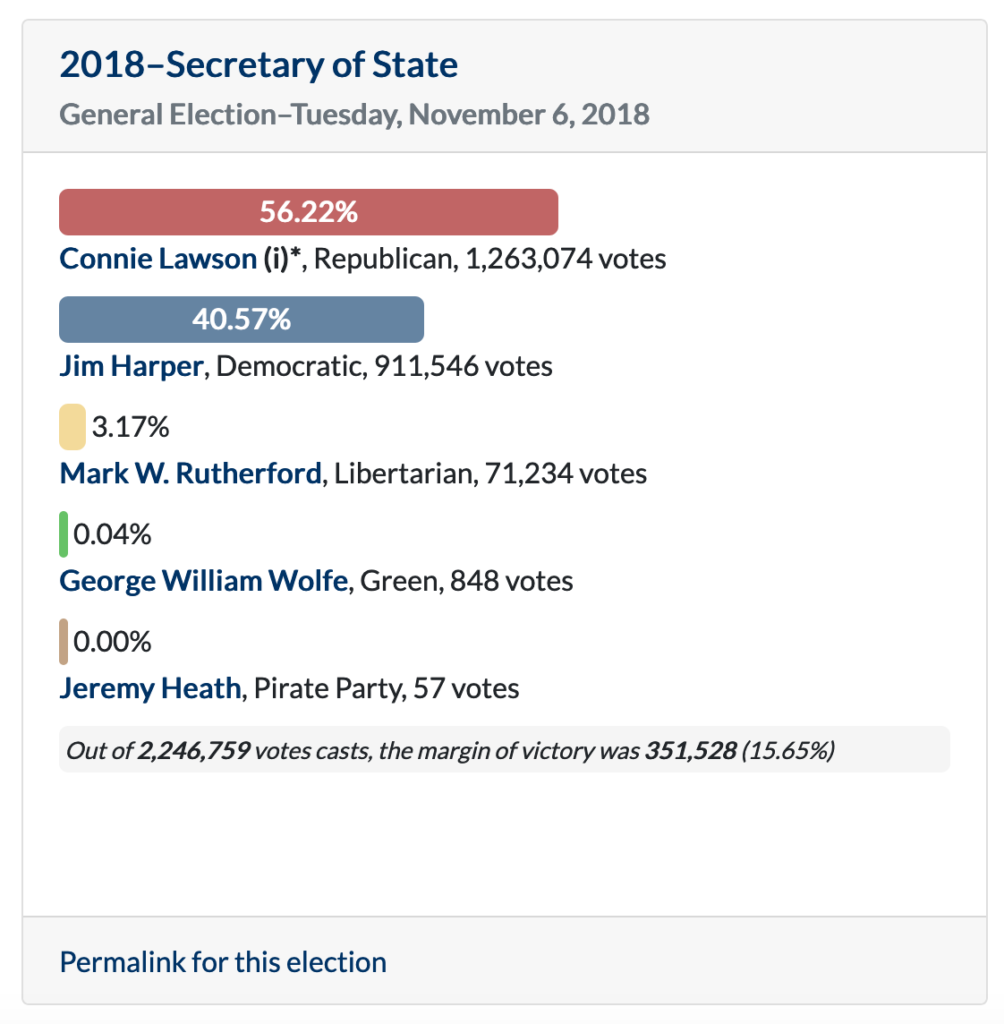
If you ever played around with some of these filters on the old version of the website, you should find the new setup to be more intuitive and easier to manipulate. But you’ll also notice that the election results are a lot easier to read. Previously, they just displayed in a simple table. But I’ve put a big emphasis on graphically displaying data in the new version. Now, for each result you’ll get a colored bar that indicates the percentage and the party, making it easier to tell a quick glance who won.
That should help you get going, but one other thing I want to note. At the bottom of every link is a link that says “Permalink for this election.” If you need to copy and paste an election result to share, that’s the link you want. But more importantly, when you click it you will get that result on a page of it’s own. In the future, I plan to add county-level results for each election and this is where you will find it. In fact, I’ve already gone ahead and done this for the 2018 election results. This is what it looks like:

Electoral vote records
Sometimes, though, you don’t care about individual races as much as you care about statistics from those races. For instance, maybe you don’t care to see every gubernatorial election result, but you want to know who has the record for the most votes in a gubernatorial election. For that, we have the Electoral Vote Records page.

The filters on this page work in the same way as the Election Results page. You can filter by any of the following records, for any office, and any election type (and you can exclude races with unopposed candidates that might skew the results):
- Most votes by a single candidate
- Most votes by a losing candidate
- Highest percentage by a single candidate
- Largest vote margin of victory
- Smallest vote margin of victory
- Largest percent margin of victory
- Smallest percent margin of victory
- Most votes in a career*
- Most elections won in a career*
- Most elections lost in a career*
*Based on the elections currently in the database
Length of tenure records
One of my favorite tools on the website is the Length of Tenure records. For anyone who has ever held office, this database keeps track of the number of days they held office, and this tools converts it into years, months, and days, and ranks them against everyone else based on length. If the officeholder is currently in office, it updates daily and will calculate what date they will move up to the next ranking.

The filtering is the same for this page, but there are only two options: The office or offices you want to group the politicians by (with a sub-option to only look at those currently still in office); and the service years (which allows you to look at only people who held office in a certain time period, or started after a certain date.
One more quick note: You’ll notice on the image above that it tells you the average length of service time for everyone on the current filtered list. This can be incredibly helpful to quickly determine things the average length of service of current Indiana Congressmen is, or to compare the average length of service between state senators in the 1800’s to state senators serving today.
Legislative caucus elections
This page is automatically updated every time a state legislative vacancy is filled via party caucus. It presents the data in three views: A list of current legislators who first came to their current chamber by way of caucus; a list of all legislators who came into a chamber by way of caucus; and a list of those members who have managed to win election to both chambers of the General Assembly by way of caucus.